Quick answer
Quantitative research collects numerical data, usually through surveys, experiments or existing datasets, and analyses it with statistics to measure and test relationships. Qualitative research collects words and observations, usually through interviews or focus groups, and analyses them for themes to understand experiences. Choose quantitative for how much or to what extent questions, and qualitative for how and why questions.
Choosing between quantitative and qualitative research is one of the first big decisions in a dissertation or research project. It shapes how you collect data, who you recruit, how you analyse your results and even how you write your findings chapter.
The short version is that quantitative research works with numbers to measure things and test relationships, while qualitative research works with words, images and observations to understand experiences and meanings. Neither is better. The right choice is the one that fits your research question, the data you can realistically get and the conventions of your subject.
This guide explains both approaches, compares them side by side, shows examples from different subjects and gives you a step-by-step way to decide, including when mixed methods make sense.
What is quantitative research?
Quantitative research collects numerical data and analyses it with statistics. It is used to measure how much or how often something happens, to compare groups and to test whether variables are related. It usually starts from existing theory and tests hypotheses, which is a deductive approach.
- Typical methods: questionnaires with closed questions, experiments, structured observation and secondary datasets
- Typical samples: larger groups, ideally chosen so that results can be generalised
- Typical analysis: descriptive statistics, t-tests, ANOVA, correlation and regression, often in SPSS
- Example question: 'To what extent does flexible working predict job satisfaction among UK nurses?'
What is qualitative research?
Qualitative research collects non-numerical data, such as interview transcripts, focus group discussions, documents or field notes, and analyses it for patterns and meanings. It is used to understand how people experience something and why they think or act as they do. It often builds understanding from the data upwards, which is an inductive approach.
- Typical methods: semi-structured interviews, focus groups, observation and document analysis
- Typical samples: smaller groups chosen on purpose because they have relevant experience
- Typical analysis: thematic analysis, content analysis or narrative analysis, by hand or in NVivo
- Example question: 'How do newly qualified nurses experience the move from student to registered nurse?'
Quantitative vs qualitative: the key differences
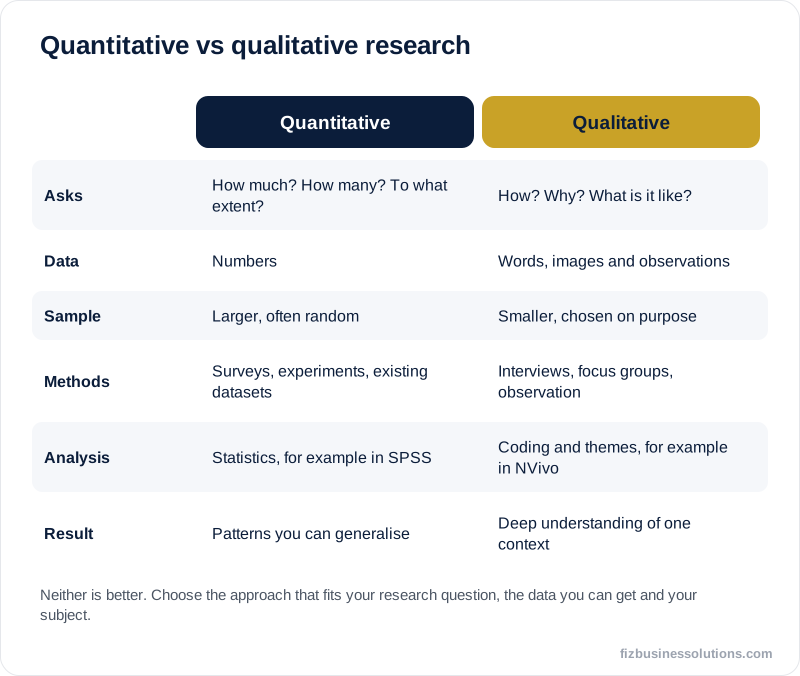
- Purpose: quantitative measures and tests; qualitative explores and explains
- Question types: quantitative asks how many, how much or to what extent; qualitative asks how and why
- Data: numbers and statistics versus words, images and observations
- Sample: larger and often random versus smaller and purposive
- Analysis: statistical tests versus coding and themes
- Results: generalisable patterns versus rich, context-specific understanding
- Quality: judged by validity and reliability versus trustworthiness, including credibility and transferability
Data collection methods in each approach
Questionnaires and surveys
Closed questions, such as Likert scales, produce quantitative data. Open questions produce qualitative data. Many student questionnaires include both, but the closed questions usually drive the analysis.
Experiments
Common in psychology, health and the sciences. You change one variable and measure the effect on another, usually comparing groups with statistical tests.
Secondary data
Existing datasets, company financial reports or official statistics. Popular in finance, economics and public health because they give large samples without new data collection.
Interviews and focus groups
The main qualitative methods. Semi-structured interviews follow a guide but let participants explain in their own words. Focus groups show how people discuss a topic together.
Observation and documents
Observation can be structured, with counts and checklists, or unstructured, with descriptive field notes. Documents such as policies, reports or social media posts can be analysed either way.
Sampling in quantitative and qualitative research
Quantitative studies aim for samples that represent a wider population, so random or stratified sampling is preferred where possible, and sample size is often justified with a power calculation. Many student projects use convenience samples and should say so as a limitation.
Qualitative studies choose participants on purpose, for example people with a specific experience, and may use snowball sampling for hard-to-reach groups. Sample sizes are smaller and are justified by depth and by the point at which new interviews stop adding new insights, often called saturation. Check what your department expects for your level.
How the data is analysed
Quantitative analysis starts with cleaning the data and describing it with frequencies, means and standard deviations, then moves to inferential tests that match your question and variables, such as t-tests, chi-square, correlation or regression. Our guide to choosing a statistical test covers this step in detail.
Qualitative analysis usually means reading and re-reading your data, coding it, grouping codes into themes and checking those themes against the data. Braun and Clarke's thematic analysis (2006) is the most widely used approach in student dissertations, and NVivo can help you manage the coding.
How to choose: five questions to ask yourself
- 1What is my research question asking? 'How much', 'how many' and 'to what extent' point to quantitative; 'how' and 'why' point to qualitative.
- 2What data can I realistically get? A survey of 150 people or 10 in-depth interviews may be very different in difficulty for your topic.
- 3What skills and time do I have? Statistics and interviewing both take time to learn and do well.
- 4What does my subject usually expect? Look at recent dissertations and journal articles in your field.
- 5What does my supervisor recommend? Agree the approach before you collect any data.
5 examples of quantitative and qualitative research
Business and management
- Quantitative: Does employee engagement predict intention to leave in UK retail?
- Qualitative: How do line managers in UK retail experience managing hybrid teams?
Education
- Quantitative: Do students taught with retrieval practice score higher on end-of-unit tests?
- Qualitative: How do secondary teachers decide when to use retrieval practice?
Health and nursing
- Quantitative: Is hourly rounding associated with fewer falls on older adult wards?
- Qualitative: How do patients describe feeling safe during a hospital stay?
Psychology
- Quantitative: Is daily social media use related to sleep quality scores in first-year students?
- Qualitative: How do first-year students describe the pressure to stay online at night?
Marketing
- Quantitative: Does a free delivery offer increase the average order value of online shoppers?
- Qualitative: Why do shoppers abandon their basket at the delivery page?
What about mixed methods?
Mixed methods research combines quantitative and qualitative data in one study so that each strengthens the other. Common designs include collecting both at the same time and comparing them, running a survey first and then interviews to explain the results, or running interviews first to design a better survey.
Mixed methods can be powerful, but they take more time and need skills in both kinds of analysis. For a short Master's dissertation, a single well-executed approach is often the safer choice unless your question clearly needs both.
Common mistakes when choosing a method
- Choosing a method first and then writing a question to fit it
- Calling a study qualitative because it uses a questionnaire with a few open questions
- Using interviews but then trying to generalise the findings to a whole population
- Collecting survey data with too few responses for the statistical tests you planned
- Describing the method without justifying why it suits your research question
Reference your sources in seconds
Paste a DOI, ISBN or web link into our free Harvard referencing generator and get the full reference and in-text citation, ready to copy into your work. Using APA 7? Try the free APA referencing generator.